
In the coming months, Apollo Mapping will be unveiling the industry’s most affordable, scalable and secure spatial cloud, the GISrack. While we are busy building out the infrastructure and technology required to support the most flexible GIS cloud on the market, now is a great time to explain a bit about the GISrack.


Some of you may have used other GIS cloud services in the past, and in many ways the GISrack will be similar to these. But the GISrack will distinguish itself in a variety of important manners. Here is a list of the key features that will be unique to the GISrack:
- Near-instant set-up–unlike other GIS clouds, the GISrack will take less than five minutes to sign up for, load data on to and get started using. No other cloud comes close to that flexibility.
- Tons of free spatial data–included with every subscription is access to more than 4 terabytes (TB) of free vector and raster data covering the United States and many parts of the world.
- A marketplace for spatial data – all users will have access to a library of spatial data that can be added to your GIS cloud. Further, users will be able to post data they have created to the marketplace to sell to other users (or let them use for free if you wish).
- Cloud computing – we will ask all users for feedback on the spatial operations they perform most frequently and will then implement the most popular ones in the GISrack.
- Free entry-level subscriptions – users will be able to use the full-functionality of the GISrack with up to 25 megabytes (MB) of free storage and bandwidth. And once you pass this storage limit, subscriptions will start at just $5.00 per month!
- A robust online viewer–for those users in your organization lacking access to a GIS application, the GISrack will feature an online viewer that can be accessed from anywhere in the world as long as users have internet access.
- Enhanced browsing speeds – we will have all of your spatial data cached in multiple locations around the world so access times will be greatly reduced for international users.
- Flexible streaming architecture – administrators will be able to setup multiple WMS and WFS feeds that can be shared with the appropriate teams of data users. Each feed can be seeded with the datasets these users need access to.
- Industry-leading data redundancy – with 99.999999999% data redundancy, you can be assured that your data will not be lost once placed on the GISrack.
Do you have any specific questions you would like answered about the GISrack? Or perhaps you want to join the beta program? If so, let us know by email at sales@apollomapping.com.
Old habits–and interests–die hard. Last stop had us in sunny Arizona on the campus of the University of Arizona and in Tucson. We got there via a connection with Hawaii and the Maui Invitational basketball tournament (U of A won it in 2014). Well, we’re sticking with the basketball theme (yet again) and as this goes to press, we’re in the final week of the NCAA tournament, aka March Madness. As has been their calling card since Lute Olson established a dominant program, the Wildcats had yet another good run in the tourney. Alas, not long enough for ‘Cats fans, as it ended in the Elite 8 against the Badgers of Wisconsin–the same way it did last year for the desert dwellers.
 Bascom Hall is located on top of Bascom hill and was originally built in 1857. It is currently home to the chancellor and vice-chancellors of the University of Wisconsin. A 50-cm color image captured by WorldView-2 on August 25, 2012 and comes courtesy of DigitalGlobe. Photo enhanced by Apollo Mapping.
Much as Lute Olson is synonymous with U of A basketball, so too is the Badgers’ coach, Bo Ryan. Having been at the helm of the ship since 2001, the Badgers have been one of the most consistent programs in that time frame. He didn’t travel far for his new gig; only 75 minutes down the road, but what a find. Ryan won 4 national championships at the Division III level, and has repeatedly turned down offers from other schools. He is giving the AD, Barry Alvarez, the consistency and loyalty he expects, especially in the face of the recent head coaching issues with the university’s football program. After one Elite 8 and four Sweet 16 appearances, Ryan and the Badgers are in their second consecutive Final 4. The field is rounded out by fellow Big Ten power Michigan State, currently undefeated Kentucky and Duke, led by Coach K who is making his 12th Final 4 appearance in his tenure. For those of you who want to look into the future, I think it would be a safe bet to say next month’s top on the Small World tour will be on one of the other three campuses. Just a little foreshadowing.
In 1985, Richard Moll wrote a book about the “public ivies,” i.e. those public institutions that were on par with the education and research of the Northeastern collection of upper-crust schools. And while UW didn’t make the first eight, they received honorable mention (along with three other Big Ten schools!); and the Badgers are consistently acknowledged far and wide for the campus’ academic prowess. Forbes has the main campus listed as top 70 overall (remember, there are 3,500 4-year accredited colleges and universities in the States!), and some of their programs are Top 5. Their sociology program is arguably the best in the country.
 Camp Randall Stadium has been the home to Badgers’ football since 1895. It seats 80,000 screaming fans and is the 5th largest in the Big Ten. Each home game between the 3rd and 4th quarter, House of Pain’s “Jump Around” is played to rile up the crowd. It has been said to shake both the bleachers and the bones. A 50-cm color image captured by WorldView-2 on August 25, 2012 and comes courtesy of DigitalGlobe. Photo enhanced by Apollo Mapping.
Sometimes known as The City of Four Lakes, Madison is one of those beautiful college towns where there’s no surprise why high school seniors want to spend their defining years there. Nestled between Mendota, Monona, Waubesa and Kegonsa, the sprawling campus is captivating in every way possible. Running trails and bike paths snake through the capital city. State Street abuts campus and offers endless social venues such as campus staple bars and diverse food offerings. Performing arts and music festivals are the norm throughout the calendar year.
And being that UW is in the midst of the “heartland,” football obviously plays a big role during the fall. I would argue that the best season in any section of the country is fall in the Midwest, and when you have that Indian summer weather in September and October, college football just makes it that much better. Tailgating is the norm during football season, and it is the best in Big Ten country. Beer, brats and more beer, the Midwest coeds (and alums) know how to take advantage of the season. Every school has their traditions, and UW is no different. One of their many rituals is the playing of House of Pain’s “Jump Around” between the 3rd and 4th quarter of every home game by the marching band. The stadium is said to shake and rattle, and I imagine that is often the case when the Badgers have the lead. If UW caps off the season on a high note in men’s basketball, I imagine that song will be played a time or two.
Justin Harmon
Staff Writer
From the Communist nation of North Korea we travel across Asia to the non-aligned country of India for this stop on the Pléiades 1 Stadium of the Month. Specifically, we descend on the historic city of Kolkata with a look at one of the world’s (formerly) largest stadiums, Yuva Bharati Krirangan (or Salt Lake Stadium).
Name & Its Origin: The Pléiades 1 stadium of the month for May is Yuva Bharati Krirangan. Translated in English as Salt Lake Stadium, it appears that the structure takes it names from the shallow saltwater ponds that are located close by in the surrounding town of Bidhannagar, India.
Location: Yuva Bharati Krirangan is located in the planned community of Bidhannagar which is a suburb of one of India’s oldest cities, Kolkata. Situated 10 kilometers from downtown Kolkata, the stadium is approximately 11 meters above sea level. The salt lakes which give Yuva Bharati Krirangan its name were reclaimed in 1963 after seven years of filling them in with silt.
Stadium Capacity/Size, Architect & Build Date: Inaugurated in 1984, Yuva Bharati Krirangan was once the second largest non-race track stadium in the world seating some 120,000 spectators and covering 309,000 square meters of ground. However, in 2014, the stadium was upgraded and the capacity was reduced to just 68,000. Yuva Bharati Krirangan was designed and built by the team of Ballardie, Thompson & Matthews and H.K. Sen & Associates.
 A 50-cm color image of Yuva Bharati Krirangan, Bidhannagar, India collected on October 18, 2012 by Pléiades 1A. To see this stadium in SPOT 6/7 1.5-meter resolution, check out this month’s feature on SPOTMaps. Image photo enhanced by Apollo Mapping. © CNES 2015, Distribution Airbus Defense and Space / Spot Image S.A., France, all rights reserved.
Type of Field Surface: In 2009, the field at Yuva Bharati Krirangan was replaced with an artificial 90,000 square feet “grass” surface made by FieldTurf. FieldTurf is installed in more than 7,000 fields across the world including in many major soccer and football stadiums.
Key Sports Teams: Yuva Bharati Krirangan is home to the Indian national soccer team as well as three I-League soccer teams–i.e. Mohun Bagan Athletic Club, East Bengal Football Club and Mohammedan Sporting Club–and one Indian Super League Team, Atlético de Kolkata.
Most Popular Yearly Event: While Yuva Bharati Krirangan hosts a variety of cultural and sporting events each year, from the various news stories on the stadium, it appears that soccer is the most popular event held here. The national soccer team plays many of their matches at Yuva Bharati Krirangan, rotating them between India’s three FIFA-approved stadiums.
Fun Factoids: (1) Yuva Bharati Krirangan hosted one of the largest soccer matches ever held in the world and the largest in Indian football history with some 134,000 spectators watching the 1997 Federation Cup Semifinal between East Bengal and Mohun Bagan. (2) Famed German goalkeeper, Oliver Kahn, played his last match for Bayern Munich at this stadium on May 27, 2008 in a friendly versus Mohun Bagan. (3) There are four onsite, underground reservoirs which are used to fight fires should they break out.
The Pléiades 1 High-Resolution Satellite Constellation
The Pléiades 1 constellation (or at least part of it!) has been in orbit since December 2011 and if you have not had a chance to check out any sample imagery, take a few moments and have a look at the gallery on our website. If you work with high resolution imagery, you should consider Pléiades 1 for your next geospatial project.
A variety of Pléiades 1 products are available from both a growing archive and as a new collection, including 50-centimeter (cm) pansharpened imagery and 50-cm panchromatic–2-meter (m) 4-band multispectral bundles. We are happy to discuss the technical specifications, pricing and tasking options available with this satellite constellation.
Working with Pléiades 1 since the launch of the first twin satellite, P1A, we have noticed that:
- Airbus Defense and Space is able to deliver on their tasking feasibilities.
The Apollo Mapping sales team can answer any questions you might have about the high resolution satellite constellation, Pléiades 1. We can be reached anytime at (303) 993-3863 or sales@apollomapping.com.
More sample images and technical information about Pléiades 1A and 1B can be found on our website here.
- As we do every now and then in this short snippet on technological updates, we turn our attention to fun and random advances that fit no broad category.First, a few improvements that might make our homes more comfortable and/or sustainable places to live in. It appears that USB power sources could save a considerable amount of energy as they convert AC to DC electricity more efficiently. Or how about piping some nice, natural sunlight into interior or otherwise dark rooms during the daytime? This idea is a novel approach to reducing the amount of energy used to bleach our laundry.
And now a few technologies that can make our 1’s and 2’s more sustainable, such as this solar-powered toilet that can turn waste into biochar (a biological charcoal). Or this idea which uses urine to create power in disaster zones. Perhaps cow manure could be a source of clean water and fertilizers in rural communities?
Finally, we close with an idea that is just plain weird and fun, whereby used cigarette butts are converted into an energy-saving coating for parts in computers, portable electronics and even wind turbines.
 The March 2015 Land and Ocean Temperature departure from average map. Warm conditions were seen across western North America as well as the Middle East and northern Europe and Asia; with cold conditions continuing throughout eastern and southern North America.
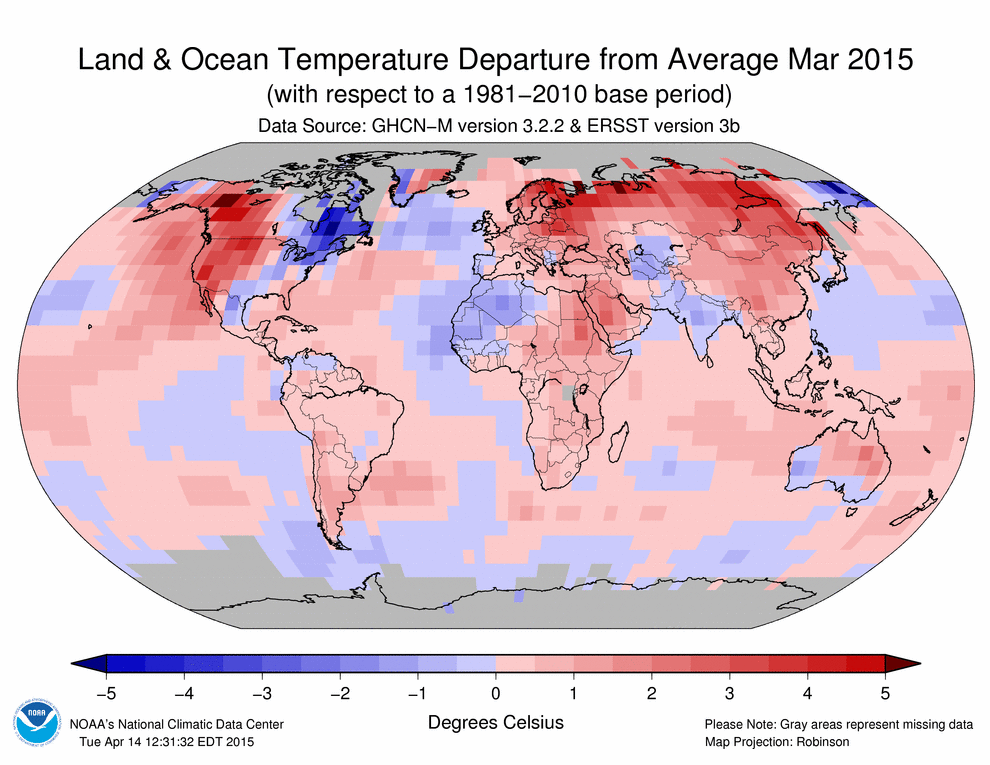
- Just released, the NOAA global climate report confirms that March 2015 was the warmest March in the 136 years of record keeping. The global temperature was 1.53 degrees Fahrenheit above the 20th Century average. It was also the third highest departure from average of any month in 136-year record. One notable stand out continues to be the record to near-record cold across the USA’s East Coast and South.
- Summer is basically here and the snow melt is on in the Rocky Mountains, so in honor of this yearly transition, my Google search of the month was, “GIS and snow melt.” And while the paper that caught my attention dealt with snow melt not in the mountains or even in nature, it focused on urban snow melt–a rather unique topic. This paper by Annette Semadeni-Davies uses GIS to show the differences in regional and local snow melt as influenced by the unique conditions created by urban and suburban settings.
- From our New England stop in last month’s review of local government GIS websites, we travel a few hours south to the mid-Atlantic state of New Jersey and their largest city, Newark. Our first Internet destination in this exploration was a very basic departmental website with links to a webmap as well as contact information for the GIS team. Apparently the GIS team will help gather spatial datasets together. To put it bluntly, the web map is absolutely atrocious–few of the buttons seem to do anything and the only way I could find any spatial information was searching by address, and that information was scant at best. There is also a reference to this state-run GIS website but, again, searching here yielded no results. All in all, this was a frustrating exploration and one of the worst city GIS sites we have seen.
Brock Adam McCarty
Map Wizard
(720) 470-7988
brock@apollomapping.com
In this monthly feature, we span the globe to examine Our Changing Landscape with time series of medium resolution RapidEye satellite imagery. The RapidEye archive dates back to late 2008 and already contains more than 5 billion square kilometers of data. This month, we take another look at deforestation in Brazil as a follow up to our August 2012 piece.
The RapidEye Constellation
RapidEye is a constellation of five 5-meter medium resolution satellites each offering five spectral bands of information. The RapidEye constellation offers daily revisits to every location on the planet with a huge footprint that is 77-km wide. The data is priced competitively with a starting cost of $1.28 per square kilometer for all five spectral bands–academics do receive discounts. RapidEye adds a fifth band, the red edge, to the ‘traditional’ multispectral set of blue, green, red and near-infrared (NIR). The additional spectral data in the red edge band allows users to extract more useful land ‘information’ than can be from traditional 4-band imagery sources. When RapidEye imagery is ordered as a Level 3A Orthorectified product, images from multiple dates are extremely well registered, making it the ideal data source for Our Changing Landscape.
Deforestation in Pará, Brazil, Part II
In the August 2012 edition of Our Changing Landscape, the focus was on the causes of deforestation in Brazil. In this follow up piece, we feature a new layer stack of 5-meter RapidEye imagery collected over Pará, Brazil to show the continued deforestation in this Brazilian state. But first, here is a series of statistics on deforestation in the Amazonian forests as a whole:
 Click on the image above to see an animation of 5-meter natural color RapidEye imagery collected over rural Pará, Brazil on August 20, 2009, June 17, 2011, July 24, 2012 and August 8, 2014. The two images used in our original 2012 animation have been incorporated here; further, the area covered in the previews has been expanded and updated images added in. What you will see in this RapidEye layer stack are periods of significant deforestation in parts of the forest while other areas remain fallow and are actually reforested. This is a common pattern seen in deforestation whereby subsistence practices combined with commercial clear cuts rotate around a region, taking advantage of new and regrown plots of timber as well as “recharged” agricultural lands. (Images Courtesy: RapidEye)
- Since 1970, more than 760,000 square kilometers (sq km) of Amazonian rainforest have been cleared. That is about 19% of the total area of these forests.
- From 1960 to 1999, there was an average of 5.2 billion tons of carbon dioxide released by deforestation activities. Since that time, the running average has continued to fall with some 3.2 billion tons of CO2 released in 2009.
- From 1988 to 2004, the yearly rate of deforestation in the Amazon exceeded 15,000 sq km on average; yet since that time, the rate of deforestation has declined rapidly with most years averaging 5,000 to 6,000 sq km of clearing per year.
- About one-third of the remaining rainforests in the world are found in Brazil with some 56,000+ species of plants, 1700+ birds, 695 amphibians, 651 reptiles and 578 mammals described in the forests as of mid-2014.
- Deforestation is only half of the story when it comes to forest health in the Amazon as the Woods Hole Research Center and the Carnegie Institute suggest that the amount of degraded forest cover is roughly equivalent to the area cleared. Degraded forests have less biodiversity and are more susceptible to fires so this is a major issue that is often not discussed in mainstream media.
- 2013 saw the first increase in Brazilian deforestation in eight years with rates up 29%. The trend appears to have continued in 2014 with a 190% increase in deforestation during August and September as compared to the same period in 2013. It has been suggested that the increased rates of deforestation are the result of shifting governmental priorities; as well as more sophisticated farmers and loggers who have learned that current Brazilian satellite technology only detects clear cuts larger than 25 hectares.
- Before you pivot to the updated animation showing deforestation in Pará, let’s end the written portion of this article on a positive note. Research suggests the dramatic decline in deforestation since 2004 can be attributed (at least in part) to the significant pressure brought on government and commercial forces by local civil society and non-government organizations (NGOs). This pressure for positive environmental change has not weakened so let’s hope the increased rates of deforestation in 2013 and 2014 are just temporary blips on the radar.
If you would like to find out more about using RapidEye for your academic studies, engineering projects or any landscape analysis, let us know at sales@apollomapping.com or (303) 993-3863.
Have you checked out the new and improved Image Hunter yet?!?! If not, you should!
Listening to the feedback we received on improving imagery search engines, the new version of Image Hunter features a major overhaul to the user interface as well as to the backend architecture. Image Hunter Version 2 is built on open-source technology so now it works on all computers, not just on Windows machines. We slimmed down the user interface to make it easier to find the imagery filters and other available tools. All things said, we really think you will enjoy your browsing experience with Image Hunter (Version 2).
Key April 2015 Improvements
This month our focus was improving the search results section of Image Hunter to enhance its stability, to make it easier to use and to solve a few bugs. In the next few months, we hope to roll out an automated data alert system, stay tuned for more details on this exciting new improvement!
Image Hunter can be accessed 24 hours a day, 7 days a week and is a one-stop shop for every major source of medium and high-resolution satellite imagery on the market today, including:

- WorldView-3
- WorldView-2
- WorldView-1
- QuickBird
- GeoEye-1
- IKONOS
- EROS B
- KOMPSAT 3
- KOMPSAT 2
- The Pléiades 1 constellation
- The entire SPOT constellation
- RapidEye
If any of our readers have struggled with other geospatial search engines that are clunky, only query one data source and/or do not provide image previews, then Image Hunter is the solution to your woes, as it features:
- Online browsing of satellite imagery from 4 data providers and 19 satellites.
- Near-instantaneous loading of low resolution preview imagery with collection date, cloud cover and other key metadata.
- The ability to define your area of interest by address and with coordinates, geometric shape or shapefile/KMZ.
- A responsive basemap with street names to provide spatial context when discovering data as well as crowd-sourced updates for the most accurate map possible.
- Exports of the area of interest you create as well as the scenes you select in shapefile or KMZ format.
- Support for all operating systems, and not just our friends with Windows machines!
The new version of Image Hunter can be accessed here. We are excited to find out what you think about Version 2!
If you have any ideas and/or feedback to improve the new Image Hunter, please let us know at sales@apollomapping.com or (303) 993-3863.
Do you have the need for regularly updated images of locations around the world?
Perhaps you need imagery to integrate with an OEM solution you are developing?
Or maybe your organization uses large amounts of high-resolution imagery each year, and you are seeking a low-cost option for this data?
If you answered yes to any or all of these questions, then the solution you are looking for is DigitalGlobe Basemap (DGB).
With DigitalGlobe Basemap, you have access to millions of square kilometers of imagery with low cloud-cover and off-nadir angles. This data is accessible in streaming web-mapping services as well as through an online viewer. And perhaps the most important feature of DGB is the regular updates you can receive as out-dated imagery is often of little or no use to our valued clients.
April 2015 DigitalGlobe Basemap Product Update
Here are some statistics about the imagery updates that occurred in the last month to the DGB database:
 A coverage map showing available DigitalGlobe Basemap imagery over Western Europe by location and the most recent coverage date as of April 13, 2015. In many locations, there are multiple imagery dates available.
- From March 18th to April 15th, more than 17.04 million square kilometers of color data was added
- Color coverage of the Earth’s landmass (minus Greenland and Antarctica) increased 0.73% to 88.3%.
- In the Basemap USA Refresh version of DGB, there are 28 states plus Washington DC and Puerto Rico that have 90% or more coverage that is less than 12 months old:
- Delaware–100.0%
- Washington DC–100.0%
- Hawaii–100.0%
- Rhode Island–100.0%
- New Jersey – 100.0%
- Nevada–99.75%
- Puerto Rico – 99.35%
- California–98.67%
- New Hampshire–98.56%
- Arizona–98.50%
- New Mexico–97.99%
- Kansas–97.65%
- Florida–97.53%
- South Carolina–96.81%
- Minnesota–96.61%
- Nebraska–96.34%
- Maine–95.74%
- Oregon–95.33%
- Texas–93.71%
- Massachusetts–93.45%
- Oklahoma–93.34%
- Utah–93.21%
- Idaho–92.85%
- Iowa–92.81%
- Illinois–92.35%
- Pennsylvania–91.31%
- Wyoming–91.00%
- Arkansas–90.35%
- Vermont–90.34%
- South Dakota–90.07%
DigitalGlobe Basemap Product Specifications
- Geographic Regions Covered: defined area of interest, US county, country or global
- Maximum Imagery Resolution: 50-centimeters through WMS and WCS; 60-cm for other delivery mechanisms
- Data Sources: primary = WorldView-2 and GeoEye-1; secondary = QuickBird, IKONOS, WorldView-1 and aerial
- Database Update Frequency: annual, semi-annual, quarterly or daily; updates are to limited portions of the database, not the entire database
- Data Accuracy: 8.5-meter CE90%
- Database Access: OGC streaming services (i.e. WMS, WMST, WCS and WFS), Google Earth streaming services (i.e. EarthService), ArcGIS plugin (i.e. ImageConnect), offline database and online portal
- Pricing Model: transactional and unlimited tiered subscriptions based on geography and number of users (with uplifts for more frequent updates and imagery downloads)
- Subscription Term: annual
For more information on the pricing and coverage available in DigitalGlobe Basemap, you can reach our sales team anytime at sales@apollomapping.com or during typical business hours at (303) 993-3863.
Every time we look at WorldView-3 (WV3) imagery, we are blown away. So we have decided to make this article a monthly feature for the viewing joy of our valued readers. This month, we feature three color 30-centimeter (cm) WV3 images collected over the coastal town of Sousse, Tunisia.
Monthly Product Updates


This month we feature three more amazing 30-cm color WV3 images collected on January 10, 2015 over the coastal Mediterranean town of Sousse, Tunisia. In the first image, check out the detail you can see on the glass ceiling windows. In the second, you can see a maze of small, connected buildings in old town Sousse. And the final image features a peaceful beach where I would love to plant my towel and umbrella for a sunny afternoon! These images have been photo enhanced by Apollo Mapping. (Images Courtesy: DigitalGlobe)
This month we have one important WorldView-3 updates to share with our readers:
- Starting on April 1st, the price for several WorldView-3 imagery products increased. We are happy to share this new pricing with you if you email us at sales@apollomapping.com.
If you have not heard of the recently-launched satellite, WorldView-3, here are the features that really set it apart from the competition:
- Improved Resolution
- Higher resolution means you can see more detail in WV3 imagery.
- Data collected at nadir will have 31-centimeter (cm) panchromatic, 1.24-meter (m) visible and near infrared, 3.7-m shortwave infrared (SWIR) and 30-m CAVIS bands.
- At 20 degrees off-nadir, the resolution is 34-cm panchromatic, 1.38-m visible and near infrared and 4.1-m short-wave infrared.
- Per US government regulation, all SWIR orders are produced at a maximum resolution of 7.5-m. CAVIS bands are not available for purchase at this time.
- Additional Spectral Bands
- If spectral analysis is part of your project, then no other satellite can match WV3 with its: 8 bands of visible and near-infrared data; and 8 shortwave infrared bands which are crucial for geological studies.
- Better Positional Accuracy
- With accuracies of 3.5-m CE90% or better (without ground control even!), WV3 has no rivals for its enhanced positional accuracy.
- Daily Revisits
- At 40 degrees latitude, WV3 will be able to image each location daily with 1-meter or better resolution and then every 4.5 days at 34-cm resolution or better.
- Increased Collection Capacity
- WV3 features a 13.1-km swath width (at nadir) with the ability to collect up to 680,000 square kilometer (sq km) of high-resolution data per day.
- Improved control movement gyros translate into larger maximum contiguous collection areas per pass, with up to ~7,500 sq km of mono imagery and ~3,000 sq km of stereo possible.
If you are interested in WorldView-3 imagery for your next project, please let us know by phone, 303-993-3863, or by email, sales@apollomapping.com.
You can also find more samples and technical information on our website here.