
- From one of my favorite technology topics, solar energy, I pivot my attention this month to one of the coolest materials “recently” discovered, graphene.
This wonder material seems to have a million and one uses, so here are just a few of them that caught my attention. Silk is the strongest material found in nature and by spraying it with a graphene coating, it can be made 3.5 times stronger, which should be strong enough to catch a falling airplane! Crumpled graphene might lead to highly stretchable (and wearable) materials that can also store power. Other research suggests graphene might be a source of renewable energy by literally extracting hydrogen gas from thin air.
Now, here are two intriguing medical uses for graphene. First, this idea could lead to stronger and more durable artificial muscles. And then perhaps graphene could be used as the base substrate to print neurons, what?!
While graphene is quite the wonder material, it is very hard to produce at a commercial scale, but hemp supercapacitors might actually be just as good for a fraction of the cost. As a rebuttal, recent advancements by MIT and University of Michigan researchers might make commercial-scale graphene production finally possible.

The May 2015 map of temperature departure from average. Northern Asia and North America were far hotter than average while pockets of relative cold were found over the mid-section of the USA, Russia and Australia.
- The May 2015 NOAA Climate Report confirms that this May was the hottest in the 136-year temperature record. In fact, if you were to look at monthly temperature departure from average, February and March 2015 were the highest departures every recorded, and then May 2015 was the fourth highest departure–that is a disturbing trend no matter how you look at it.
- Summer is in full swing and in honor of the season of fireworks, cotton candy and (veggie) hot dogs, my Google search this month was, “GIS and hot dogs.” If you scan through the results, you might come across this paper by University of Michigan student, Kathryn Neckerman, which uses GIS to measure food access in urban areas. Specifically, Nerkerman used GIS to measure access to healthy foods across New York City with results that might not surprise those of you involved with and/or interested in economic justice and equality.
- From the Southwest we travel to the center of the East Coast with a review of the GIS resources New York, New York makes available online. For a city of the Big Apple’s size, you might think they would be leaders in online mapping technology, but I would not say that is the case. They do have a nice webmap that can be accessed here with tons of layers and the ability to create permalinks, but it is still pretty limited in functionality. Then there is a gallery of preset map views found here. The biggest gap I see is easy access to shapefile and raster formats of the spatial layers that make up the webmap, though some of them appear to be available here.
Brock Adam McCarty
Map Wizard
(720) 470-7988
brock@apollomapping.com
Have you checked out the new and improved Image Hunter yet?!?! If not, you should!
Listening to the feedback we received on improving imagery search engines, the new version of Image Hunter features a major overhaul to the user interface as well as to the backend architecture. Image Hunter Version 2 is built on open-source technology so now it works on all computers, not just on Windows machines. We slimmed down the user interface to make it easier to find the imagery filters and other available tools. All things said, we really think you will enjoy your browsing experience with Image Hunter (Version 2).
Key May 2015 Improvements
This month we hired a new team member who will be dedicated to making Image Hunter improvements. During his first few weeks with us, Som already found a few bugs that prevented Macs from submitting Image Hunter requests and is working to improve the stability of the daily update process.
Image Hunter can be accessed 24 hours a day, 7 days a week and is a one-stop shop for every major source of medium and high-resolution satellite imagery on the market today, including:
- WorldView-3
- WorldView-2
- WorldView-1
- QuickBird
- GeoEye-1
- IKONOS
- EROS B
- KOMPSAT 3
- KOMPSAT 2
- The Pléiades 1 constellation
- The entire SPOT constellation
- RapidEye
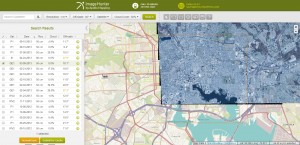
If any of our readers have struggled with other geospatial search engines that are clunky, only query one data source and/or do not provide image previews, then Image Hunter is the solution to your woes, as it features:
- Online browsing of satellite imagery from 4 data providers and 19 satellites.
- Near-instantaneous loading of low resolution preview imagery with collection date, cloud cover and other key metadata.
- The ability to define your area of interest by address and with coordinates, geometric shape or shapefile/KMZ.
- A responsive basemap with street names to provide spatial context when discovering data as well as crowd-sourced updates for the most accurate map possible.
- Exports of the area of interest you create as well as the scenes you select in shapefile or KMZ format.
- Support for all operating systems, and not just our friends with Windows machines!
- The new version of Image Hunter can be accessed here. We are excited to find out what you think about Version 2!
If you have any ideas and/or feedback to improve the new Image Hunter, please let us know at sales@apollomapping.com or (303) 993-3863.
Yep, another rerun from last month, but this is an important topic in case you missed it!

A 50-cm color Pléiades 1A image collected over Buenos Aires, Venezuela on February 7, 2013. Photo enhanced by Apollo Mapping. © CNES 2015, Distribution Airbus Defense and Space / Spot Image S.A., France, all rights reserved
Effectively immediately, we are happy to announce that qualifying academics now receive a 50% discount on all Pléiades 1 products including archived and tasked mono and stereo imagery. With a constantly expanding archive and rapid new collections of imagery, 50-centimeter panchromatic and 2-meter multispectral Pléiades 1 data is an ideal solution for your next academic project.
Please note that this discounted pricing on Pléiades 1 products is only for a single user per imagery order.
If you have questions about this new Pléiades 1 academic pricing, please email the Apollo Mapping sales team at sales@apollomapping.com.
And for more information on Pléiades 1, please check out our website here.
You might notice some changes this month as three columns have been abandoned to focus on other areas of interest. We noticed, and perhaps you did as well, that those old columns (i.e. Small World, Outside the Box and Back to School) were yawners. About the only thing they were good for was a sleepless night where Nyquil and whiskey just weren’t doing the trick. Other than that they came to the party empty-handed. And you’ll notice that staff writer Justin Harmon is no longer on call either; he got buried too. Figuratively, of course. Maybe…
So I’m in charge of the new direction for some of this content. I don’t promise anything. I hope you don’t expect much. This column, Remote Senselessness, will be a sort of hodgepodge of things. There will be no theme, just some topic that I find interesting, unique or odd, will make its way into press in some form or another. One month may visit a TV show, the next we may investigate a hot dog stand. Who knows? I certainly don’t.
Another column to help fill the void will be The Geography of My Mind. This will be the philosophical ramblings of yours truly. Topics here will be broad too; and most of them come to me when I’m not using my brain for anything productive. Some topics may have a layer of appeal, others may cause you to ask, “Why I didn’t keep that to myself?” Vague, you say? Well, just read this month’s incarnation; it’ll spell it out for you.
So now back to this here column, Remote Senselessness. This month, I will be trying on my old man pants and wishing for the “good ole days” when life was easier. Reminiscing about the glory days of my youth, those defining people, experiences and triumphs that made me who I am today: MTV. Not the MTV of today that doesn’t play ANY music, but the MTV that changed how people listened to music.
The first song to air on Music Television (MTV) was “Video Killed the Radio Star” by The Buggles. What, you had no idea who sang that either? Surprise, surprise. When I hear it these days it annoys me profusely. I guess a lot of songs from that era do the same thing. But it reminds me of coming home after school and listening to/watching music videos until my folks got off work and told me to quit staring at the idiot box. Inevitably, I would be sent to my room to do homework, but I had a stereo in there so I could make-believe my own rock videos under the guise of diligently doing my studies. I had this really cool Dukes of Hazzard toy guitar that I foolishly ruined by scraping off the decals and then writing Bad Medicine on the back because I really liked Bon Jovi. I saw that guitar on eBay a few years back and it was fetching bids in the several hundred dollar range. If I hadn’t been such a punk little brat, and been born with some foresight, I might have taken care of it and made a few bucks down the line. Instead, I idolized Bon Jovi of all bands. Geez.
My room is actually still the way I left it when I moved out after high school. Whenever my parents want to embarrass me, they show people what a dork I was (still am probably). Amidst all the clutter there are a few cool gems. I used to be really into skiing even though I lived in Illinois. I got to ski like 3-5 days a year tops, but still my wall is covered in ski magazine pages. I live in Colorado now and I didn’t ski once this year. I guess I was a poser back then (still am probably). Anyhow, I have this clipping of an extreme skier, some rad chick, can’t remember her name, but she is recalling one of her grade school report cards. It reads: “I still have my 5th grade report card; the one that says, ‘has good insight but lacks common sense.’ My parents keep it framed next to a picture of me skiing off a 70 foot cliff.” That was my senior quote in my yearbook. I never made it as an extreme skier, but at least I still lack common sense.
Back to MTV. Now all they show are programs like Jersey Shore and Teen Mom. I guess everybody gets their music through other avenues, but I don’t know why the channel thinks no one would watch a Top 20 countdown or Yo! MTV Raps again. I would. I think. I’m pretty sure kids would. I think. I mean, Americans love to sit in front of the strobe lite-esque flashing picture maker. Surely watching music videos that are steeped in current culture would be better than watching some drunk hillbillies race go-carts in Arkansas. But then maybe music videos today would be of the same cognitive power. I’m beginning to feel like Sisyphus pushing a damn rock here…
A few years ago there was a song called “Internet Killed the Video Star” by the Limousines. What, you had no idea who sang that either? Surprise, surprise. Better yet, you probably never heard the song either. Anyways, it’s catchy, but more importantly, true. I mean, if anyone is reading this column right now, you’re doing so online. This is called a newsletter, but it didn’t come to your physical mailbox. The internet has killed a lot of things. Are we better off with it? Probably. Has it caused a lot of headaches and dependencies that will never go away?
Hell yes.
Neil Postman wrote a book in the ‘80s called, “Amusing Ourselves to Death.” In a nutshell, it spoke at lengths about how TV killed communication and real experience. It was re-released in 2009 or so and is just as relevant in our age of the Web. So, you say, this sounds a little contradictory; I’m promoting the benefits of real music television and talking about how bad TV and the internet are for our society and the formation and growth of relationships. Well, look what the column, it’s called: Remote Senselessness. I don’t have to defend talking out of both sides of my mouth. As Hunter S. Thompson famously said, “Never apologize, never explain.” Though he kind of explains with that statement…
Dire Straits’ song “Money for Nothing” proclaims the line, “I want my MTV.” And that’s what I want. But this generation wants their MTV. So I guess I need to keep up with the times. Perspective is a funny thing. For the most part, we operate on our own and forget to consider others’ views, meanings and paradigms. But when we make the effort to do so, we find that we can relate more to our fellow (wo)man. It’s hard, and easy to forget to do, but trying to understand someone and the accompanying context can help us have better relationships. So while I miss my MTV, and chastise today’s MTV, I do so at my expense because I alienate myself from a larger cultural conversation (a crappy one at times). My MTV is still there in my memory; those videos are online; many of those bands still drag their tired bodies around the country to play Bar Mitzvahs and high school reunions. If MTV were to go back to what it was, how long would I like it? I used to watch Beavis & Butthead (yes, of MTV. No, not music programming…) growing up–loved it. A few years back they started making new episodes–didn’t love it so much. So maybe the MTV of old should be kept in a time capsule. But maybe we could just put the whole thing in there now and save future generations from the perplexing allure of the “reality” TV it has become…
Marco Esquandoles
Court Jester
 These cool panda characters will help to to raise awareness on Panda endangerment. (Graphic Credit: WWF).
The Japan branch of the World Wildlife Foundation (WWF) created a panda-themed font, and it’s way too cute for words. The font was made to raise awareness on panda endangerment. There are only around 1,800 pandas living in the wild, and they face extinction due to encroachment on their habitat and poaching.
While it hasn’t been officially released yet, you can enjoy these ridiculously cute Panda characters in the graphics found here. If you love pandas both in font form and real life, considering donating to the WWF in support of their efforts to save these beautiful animals.
Continuing the theme started in May’s Geospatial Tip of the Month (GTM), this month we debunk more satellite imagery myths that are focused on DigitalGlobe’s most recently launched bird, WorldView-3. WorldView-3 is without question the world’s most advanced commercial satellite every launched with resolution down to 30-cm; but still the news stories about its capabilities are not even close to the truth. Before we jump into this GTM, you might check out more about WorldView-3’s technical specifications here as well as our sample images.
Myth 1–WorldView-3 Offers Resolution Better Than 12-inches
One common myth associated with satellite imagery is the resolution they can offer and thus the objects they can “see” on the ground. For example, take this statement published by the US news site, NBC News:
The resolution is so ultra-high, in fact, that the federal government isn’t allowing DigitalGlobe to release the pictures at their best just yet. Due to regulatory restrictions, they have to be downgraded from a resolution of 12 inches per pixel to a fuzzier 15 inches per pixel (30 to 40 centimeters [cm] per pixel) until Feb. 21, 2015.
When this article was published on August 26, 2014, this statement was partially true but still its essence was completely wrong. The truth in this statement related to US government regulations which capped the maximum resolution for satellite imagery to 50-cm right up until WorldView-3 data was made commercially available. When WorldView-3 data was first sold, the maximum resolution you could obtain was 40-cm. And it is also true that by February 21st the US government eased regulations on resolution again so that 30-cm data could be sold.
But what is far from the truth is the statement that WorldView-3 imagery is downgraded to 30-cm resolution per pixel. This is clearly the driving theme of this short paragraph on resolution. However, in actuality, the maximum resolution that WorldView-3 collects is 31-cm. And in fact, that is only when the satellite is pointing directly down at the ground (also called off-nadir). As off-nadir increases, the resolution decreases so that the maximum resolution at 20 degrees off-nadir is only 34-cm. So the reality is that WorldView-3 does not collect 12 inch imagery; and further that most of its data, even if delivered with 30-cm pixels, has native resolution of 31-cm or higher.
Myth 2–Daily Revisits to Anywhere and Spotting Small Objects
Our second myth, well actually two of them in one, comes from an online article published by the UK news group, The Register. In the article, this claim is made about seeing small objects in satellite imagery:
A little sharpening of the images will mean it is possible to spot objects just 31cm long, almost exactly the length of your correspondent’s size 13 flip flops, from space.
This is actually a myth we debunked in last month’s edition as well. In that article, a claim was made that you could see objects on a desk. In this case, while yes the at-nadir resolution of WorldView-3 is 31-cm, this does not mean you can truly see an object 31-cm in size. First keep in mind that detecting an object’s presence and seeing it are two different things. While flip flops sitting on a piece of grass (as long as they are not green in color too) might cause this specific pixel to look black surrounded by a sea of green, it would only be a single pixel. Determining if this single pixel is a flip flop or just a small bag on the grass would require actually seeing the object with more detail than one pixel–myth debunked!
This same article goes on to make this claim:
The satellite is also exciting geogeeks thanks to specs that promise it will be able to revisit any corner of the globe every 24 hours.
And again, this statement could be called partially true. In latitudes above and below 40 degrees, it is possible to see every piece of ground every day; but it does not mean it is possible to image every piece of ground every day given the limited storage capacity of WorldView-3. Second, it does not mean that if you have a request in for a new collection of data with WorldView-3 that you are guaranteed a collection every day, it can take days, weeks or even months to receive data over a specific polygon you requested. Third, if you were to pay the price required to get daily (or near daily) images over your specific polygon, in many cases the imagery would only have 1-m resolution given the off-nadir of collection. And finally, as you move closer to the Equator, the Earth’s landmass increases in area (consider the Earth is a sphere and as you move to the center of a sphere it bulges out) so that even at 1-m resolution, daily collections are simply not physically possible.

This graphic can help to illustrate my point on revisit time better than words alone. At the Equator, there is about 25,000 miles of land mass that WorldView-3 (or any satellite for that matter) can possibly see. And then from 50 to 60 degrees North or South latitude, this same satellite can see about 18,500 miles. This means that WorldView-3 can see the same location at 50-60 degrees latitude more often than at the Equator as it has less land to potentially image as it moves to the Poles, but the same number of physical rotations around the planet. (Graphic Source: University of California Berkeley)
Myth 3–Features can be Detected Automatically in WorldView-3 Data
The final myth we will bust in this GTM was published August 13, 2014 on Yahoo! Finance:
Our automated algorithms … are able to identify all the potential football fields in Colorado. We can do it on Colorado state, we can do it on the United States, we can do it anywhere across the globe. Automated data extraction on a global scale is now possible. For the changing planet, we can create a living inventory of various things.
Again, you might call this statement half true as it is 100% correct to say that features like football fields can be extracted automatically from satellite imagery. But the real question to me is how accurate are these results? When information is extracted automatically from imagery is typically done by looking at both spatial and spectral characteristics–in this example, we would be looking for long rectangles (i.e. spatial) covered with living green grass or Astroturf (i.e. spectral). So while it may be possible to find some of the football fields in Colorado, those covered by a dome or by lots of trees would likely be missed; and then it would likely mis-ID large park areas which are rectangular in shape as football fields. This same story with regards to false and missing identifications using automated classification techniques can be extended to any feature such as homes, sidewalks and roads. In my experience with automated techniques, they are generally 70 to 80% accurate. How many businesses would rely upon data that is only 70 to 80% accurate? Another myth busted!
Do you have an idea for a future GTM? If so, let me know by email at brock@apollomapping.com.
Brock Adam McCarty
Map Wizard
(720) 470-7988
brock@apollomapping.com
Every time we look at WorldView-3 (WV3) imagery, we are blown away. So we have decided to make this article a monthly feature for the viewing joy of our valued readers. For June, we feature three color 30-centimeter (cm) WV3 images collected over the historic South American city of Quito, Ecuador.

This month we feature three awe-inspiring 30-cm color WorldView-3 images of Quito, Ecuador. In the first image, check out the detail you can see on the larger automobiles to the west of the circular stadium. In the second, that airplane is just too cool! And the in the final image, what is going on with the regular patterns on the central basketball (perhaps a different sport?) court?! These images have been photo enhanced by Apollo Mapping. (Images Courtesy: DigitalGlobe)
Monthly Product Updates
We are now accepting orders for 8-band multispectral plus 8-band shortwave infrared (SWIR) WorldVIew-3 data. Send us an email at sales@apollomapping.com to find out more.
If you have not heard of the recently-launched satellite, WorldView-3, here are the features that really set it apart from the competition:
- Improved Resolution
- Higher resolution means you can see more detail in WV3 imagery.
- Data collected at nadir will have 31-centimeter (cm) panchromatic, 1.24-meter (m) visible and near infrared, 3.7-m shortwave infrared (SWIR) and 30-m CAVIS bands.
- At 20 degrees off-nadir, the resolution is 34-cm panchromatic, 1.38-m visible and near infrared and 4.1-m shortwave infrared.
- Per US government regulation, all SWIR orders are produced at a maximum resolution of 7.5-m. CAVIS bands are not available for purchase at this time.
 Additional Spectral Bands
- If spectral analysis is part of your project, then no other satellite can match WV3 with its: 8 bands of visible and near-infrared data; and 8 shortwave infrared bands which are crucial for geological studies.
- Better Positional Accuracy
- With accuracies of 3.5-m CE90% or better (without ground control even!), WV3 has no rivals for its enhanced positional accuracy.
- Daily Revisits
- At 40 degrees latitude, WV3 will be able to image each location daily with 1-meter or better resolution and then every 4.5 days at 34-cm resolution or better.

- Increased Collection Capacity
- WV3 features a 13.1-km swath width (at nadir) with the ability to collect up to 680,000 square kilometer (sq km) of high-resolution data per day.
- Improved control movement gyros translate into larger maximum contiguous collection areas per pass, with up to ~7,500 sq km of mono imagery and ~3,000 sq km of stereo possible.
If you are interested in WorldView-3 imagery for your next project, please let us know by phone, 303-993-3863, or by email, sales@apollomapping.com.
You can also find more samples and technical information on our website here.

Here is the first image ever beamed back to earth by SPOT 5 just 3 days after its launch into space on May 7, 2002. This is a 2.5-meter panchromatic image of Eleusis Harbor, Greece. © CNES 2015, Distribution Airbus Defense and Space / Spot Image S.A., France, all rights reserved.
Continuing the sad trend of decommissioned satellites this year, SPOT 5 is the latest industry loss. Launched on May 4, 2002, SPOT 5 has one of the longest continuous imagery records for a commercial satellite launch. Amassing an amazing archive of 11,833,000 images, SPOT 5 collected more than 42 BILLION square kilometers of medium resolution data in its 13 year lifetime!
On March 31, 2015, SPOT 5 re-entered the Earth’s atmosphere, burning up as it traveled through the gaseous layer. Fittingly, the European built satellite collected its first image on May 7, 2002 over Eleusis Harbor, Greece; and ended its life imaging on March 29, 2015 off the coast of Baja California Sur, Mexico.
For those of you who have used SPOT 5 in the past, the huge archive of medium resolution data will still be available for sale through Apollo Mapping.

One of the last images ever collected by SPOT 5 over Stockholm, Sweden on March 11, 2015. This is a simulated 2.5-meter color SPOT 5 image. © CNES 2015, Distribution Airbus Defense and Space / Spot Image S.A., France, all rights reserved.
And for those of you requiring new medium-resolution imagery for your projects, the 1.5-meter panchromatic and 6-meter multispectral satellites, SPOT 6 and SPOT 7, will be excellent substitutes moving forward.
For more technical information on the SPOT 1 to 7 satellite constellation, you can refer to our website here or send an email to sales@apollomapping.com.