
Every time we look at WorldView-3 (WV3) imagery, we are blown away. And we hope you are equally impressed with the data! For August, we feature three color 30-centimeter (cm) WV3 images collected over my hometown of Baltimore, Maryland in the USA.
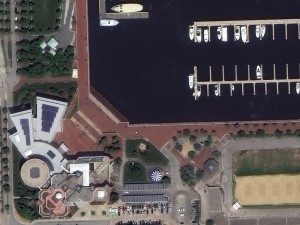
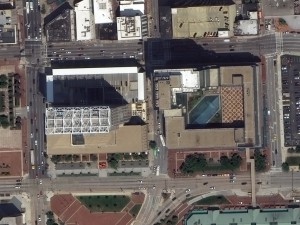

Baltimore, Maryland is known for its downtown which rings the Inner Harbor of the Chesapeake Bay. The three photos here are taken close to the Bay. The first is of M&T Bank Stadium which is home to the Baltimore Ravens. The second is the Maryland Science Center which is located right on the waterfront. And the last image is of two interesting buildings located across the street from the Harborplace. These 30-cm color WorldView-3 images were collected on June 8, 2015. Imagery photo enhanced by Apollo Mapping. (Images Courtesy: DigitalGlobe)
WorldView-3 was launched in late 2014 and is the most advanced satellite the commercial marketplace has ever had access to. Here are a few of the features that really set it apart from the competition:
- Improved Resolution
- Higher resolution means you can see more detail in WV3 imagery.
- Data collected at nadir will have 31-centimeter (cm) panchromatic, 1.24-meter (m) visible and near infrared, 3.7-m shortwave infrared (SWIR) and 30-m CAVIS bands.
- At 20 degrees off-nadir, the resolution is 34-cm panchromatic, 1.38-m visible and near infrared and 4.1-m shortwave infrared.
- Per US government regulation, all SWIR orders are produced at a maximum resolution of 7.5-m. CAVIS bands are not available for purchase at this time.
- Additional Spectral Bands
- If spectral analysis is part of your project, then no other satellite can match WV3 with its: 8 bands of visible and near-infrared data; and 8 shortwave infrared bands which are crucial for geological studies.
- Better Positional Accuracy
- With accuracies of 3.5-m CE90% or better (without ground control even!), WV3 has no rivals for its enhanced positional accuracy.
- Daily Revisits
- At 40 degrees latitude, WV3 will be able to image each location daily with 1-meter or better resolution and then every 4.5 days at 34-cm resolution or better.
- Increased Collection Capacity
- WV3 features a 13.1-km swath width (at nadir) with the ability to collect up to 680,000 square kilometer (sq km) of high-resolution data per day.
- Improved control movement gyros translate into larger maximum contiguous collection areas per pass, with up to ~7,500 sq km of mono imagery and ~3,000 sq km of stereo possible.
If you are interested in WorldView-3 imagery for your next project, please let us know by phone, 303-993-3863, or by email, sales@apollomapping.com.
You can also find more samples and technical information on our website here.
In this monthly feature, we span the globe to examine Our Changing Landscape with time series of medium resolution RapidEye satellite imagery. The RapidEye archive dates back to late 2008 and already contains more than 5 billion square kilometers of data. This month, we check back on the mountain pine bark beetle outbreak that scourged the Rocky Mountain landscape.
The RapidEye Constellation
A 5-meter color RapidEye image collected on June 20, 2014 over the section of Roosevelt National Forest, Colorado that is in the animation below. (Images Courtesy: RapidEye)RapidEye is a constellation of five 5-meter medium resolution satellites each offering five spectral bands of information. The RapidEye constellation offers daily revisits to every location on the planet with a huge footprint that is 77-km wide. The data is priced competitively with a starting cost of $1.28 per square kilometer for all five spectral bands–academics do receive discounts. RapidEye adds a fifth band, the red edge, to the ‘traditional’ multispectral set of blue, green, red and near-infrared (NIR). The additional spectral data in the red edge band allows users to extract more useful land ‘information’ than can be from traditional 4-band imagery sources. When RapidEye imagery is ordered as a Level 3A Orthorectified product, images from multiple dates are extremely well registered, making it the ideal data source for Our Changing Landscape.
A Look-In on the Mountain Pine Bark Beetle Outbreak in Colorado

Click on the image above to see an animation of the Mountain Pine Bark Beetle outbreak from 2011 to 2014 over the area seen in color above. The images used in this animation where created using a similar NDVI calculation as used in our original piece. We have used three images in this animation from June 28, 2011, June 2, 2013 and then June 20, 2014. The June 28, 2011 is the last image used in our original piece; we have also chosen an area that is as close to the original extents selected. In this animation, you can see significant deadening of the forests (dead vegetation is in red; live vegetation is in green) from 2011 to 2013 as might be expected. However, in the 2014 image, the forest looks to recover significantly. We can offer two possible explanations of this rapid green-up. First, we could be seeing understory vegetation significantly increase in vigor as the dead pines fall to the ground only to be replaced by shorter emergent grasses and bushes. A more likely explanation is that there is a thin layer of haze in the imagery which could cause our assumption of the live-dead NDVI break at 0.15 to be wrong for this date. An atmospheric correction on all three datasets could help to eliminate these differences but is beyond the scope of this article.
The first part of this piece on the mountain pine bark beetle outbreak ran in our March 2013 edition of The Geospatial Times. In this article, we introduced the epidemiology of the outbreak and also provided some statistics on its geographic extent. In this second part of the story, we will take a look back in on Roosevelt National Forest in Colorado to see how the forest’s trees may have recovered or continued to be degraded by the outbreak. But before that, a quick update on the mountain pine bark beetle outbreak seems to be in order.
- It appears that our March 2013 story may have caught the outbreak at its height as new incidents are on the decline. This makes sense as any outbreak be it a disease or insect blight, will eventually fade back as the number of healthy hosts to infect declines, in this case lodgepole, limber and ponderosa pine.
- But as one beetle outbreak fades, another one is on the rise in Colorado, a spruce beetle outbreak this time that is also in Wyoming and the Black Hills. While this outbreak will not be as significant as the mountain pine bark beetle given that its target are less common in the Rocky Mountain region (i.e. Engelmann spruce and blue spruce), it infested 338 square miles of Colorado forests in 2013. Similar to mountain pine bark, this spruce beetle outbreak is tied in part to extended periods of drought in the West.
- One interesting study about the mountain pine bark beetle outbreak suggests that the addition of the dead trees to the fire fuel load does not increase the chance for large forest fires as conventional wisdom often suggests. But even if the dead trees are not increasing fire risk, they can significantly impact the local water cycle with detrimental effects on mountain streams.
If you would like to find out more about using RapidEye for your academic studies, engineering projects or any landscape analysis, let us know at sales@apollomapping.com or (303) 993-3863.
For three years, Airbus’ twin high-resolution radar satellites, TerraSar-X and TanDEM-X, imaged the entire land surface of our planet multiple times to create the first ever global 12-meter (m) elevation model. Referred to as WorldDEMTM, this data is ideal for all mapping projects requiring accurate elevation models including orthorectification, floodplain determination, mineral exploration and hydrocarbon development.
WorldDEM August 2015 Product Updates

A coverage map of the one-degree cells that are currently available for delivery. Areas that are available will take a minimum of 10 days to deliver.
We are excited to announce that sales of the bare earth version of WorldDEM, referred to as WorldDEM DTM, have commenced! Any area that is ready to order can now be produced in all three WorldDEM formats–see below for more technical details on these formats.
During August, large sections of land in the Arctic Circle and close by were made available. WorldDEM areas that are available to order take a minimum of 10 days to deliver.
To date, there is more than 123,245,000 square kilometers (sq km) of WorldDEM data that is available! And some 3,242,000 sq km of WorldDEM was made available for delivery in the past month alone
WorldDEM Specifications
A comparison of 30-m SRTM and 12-m WorldDEM elevation data over Arkansas, USA.The key product specifications of Airbus’ WorldDEM are as follows:
- Resolution: 12-m
- Coverage: entire landmass of the Earth, ~150 million square kilometers (sq km)
- Absolute Vertical Accuracy: < 4-m Linear Error 90% (LE90)
- Relative Vertical Accuracy: < 2-m LE90 (slopes ≤ 20%), < 4-m LE90 (slopes > 20%)
- Absolute Horizontal Accuracy: < 10-m Circular Error 90% (CE90)
- Vintage: all data collected within 3 years
- Source: interferometry from synthetic aperture radar (SAR) satellites TerraSAR-X & TanDEM-X
- Minimum Order: 500 sq km per polygon
- File Format: GeoTIFF
- Projection: geographic WGS84 (EGM2008, vertical datum), meter vertical unit
- Product Line Options:
- WorldDEMcore–unedited digital surface model (DSM), includes spikes, wells and voids
- WorldDEM–a DSM with removal of artifacts and water body flattening
- WorldDEM DTM–artifacts and surface features removed, i.e. a digital terrain model (DTM)
WorldDEM Coverage and Pricing
WorldDEM data has a 500 sq km minimum order size with a 10-km width requirement. Prices for two of the product lines have been set:
- WorldDEMcore–$10.80 per sq km
- WorldDEM–$13.50 per sq km
- WorldDEM DTM–$27 per sq km
WorldDEM Samples
You can download four 12-m WorldDEM samples here, including one of the WorldDEM DTM product:
- Rapid City, South Dakota, USA–moderate to hilly terrain; elevations from 927 m to 1,765 m provided in two formats, WorldDEM and WorldDEM DTM
- Wagga Wagga, Australia–forest and urban with many water bodies; 137 m to 922 m provided in two formats, WorldDEMcore and WorldDEM
For more information about 12-m WorldDEM data, please send us an email at sales@apollomapping.com or check our website here.
- From advancements in wind power, this month we look at recent research that could improve battery technology.
First, here are three ideas for improved batteries that were inspired by nature. Norway researchers developed a “fuel cell” that creates energy when bacteria purify wastewater. Silk could help improve both the storage capacity and the longevity of current lithium-ion batteries. Or how about batteries made of alfalfa seeds and pine resin!
Now, here are some ideas to improve batteries but admittedly they do not share a common theme! A sponge-like lattice of silicon nanofibers 100 times thinner than a human hair could double the storage capacity of lithium-ion batteries. Research at Purdue University has converted old packing peanuts into highly efficient anodes for lithium-ion batteries. While Stanford University research suggests that aluminum batteries could be a fast and safe alternative to current technology.
Could a battery made simply of two gases be a reality–this research suggests that a sodium-oxygen version is possible. While we commonly burn petrochemicals, perhaps the more efficient way to use them is converting gas and jet fuel directly to energy in a fuel cell. And finally, it looks like fuel cells have moved forward fast enough to replace the loud, smelly portable light systems many of us have seen used on nighttime construction projects and/or in disaster relief efforts.

The NOAA July Temperature Percentile Departure map shows record warmth over parts of every continent other than Australia (and Antarctica as it is not included on these maps). Patches of cold could be found in Northern Europe and Asia as well as in North America.
- I am guessing this will come to no surprise for any of our regular readers, but the July 2015 NOAA Global Climate report confirms that the record warm continues. July 2015 was the warmest July on record, and in fact, it is the warmest month on record over the land and sea in the 1,627 months records have been maintained. In fact, July temperatures are currently increasing at a rate of 1.17 degrees Fahrenheit per century.
- On September 25, 1513, Vasco Nunez de Balboa first sighted the Pacific Ocean after crossing the narrow stretch of land known as the Isthmus of Panama. And in honor of this event, my Google search for the month was, “Vasco Nunez de Balboa and GIS.” In the results you might find this thesis by Kishore Srinivasa Reddy of San Diego State University who created an online GIS application that showed the paths (and more) of many Spanish and Portuguese explorers.
- From the southeast we travel to the north-west section of our country for a review of North Dakota’s largest city’s online GIS resources, Fargo. And unfortunately the online GIS resources for Fargo are certainly not ideal–the best tool they offer is this online map. However, it appears to only let users turn layers on and off, zoom in and out and other lower level map tasks. There is parcel search engine that lets you query the database by partial address or the parcel ID number. Users can also access premade maps in PDF format but I do not see anywhere to download the source GIS files–perhaps you can obtain them by emailing the GIS department directly?
Brock Adam McCarty
Map Wizard
(720) 470-7988
brock@apollomapping.com

A 30-cm color image collected by WorldView-3 over Sousse, Tunisia on January 10, 2015. This image has been enhanced by Apollo Mapping. (Image Credit: DigitalGlobe)
We are excited to announce that starting immediately through December 31, 2015, all 30-centimeter pan and 1.2-meter multispectral WorldView-3 products are now up to 35% off! This promotional pricing applies to all archive and tasking orders placed at 30-cm/1.2-m resolution. These orders would need to be placed with (not just quoted by) Apollo Mapping on or before December 31, 2015 to qualify for this discount.
If you any pricing requests, please send us an email at sales@apollomapping.com or call us at (303) 993-3863.

A 50-cm color image of London’s Wembley Stadium collected on Jily 3, 2015 by Pléiades 1A. To see this stadium in SPOT 6/7 1.5-meter resolution (and also collected on the same day!!) check out this month’s feature on SPOTMaps. Image photo enhanced by Apollo Mapping. © CNES 2015, Distribution Airbus Defense and Space / Spot Image S.A., France, all rights reserved.
For the September edition of the Pléiades 1 Stadium of the Month, we jump across the pond to the United Kingdom with a look at one of the world’s iconic homes of football, Wembley Stadium.
Name & Its Origin: The name Wembley dates back to the Anglo-Saxon era in the United Kingdom. “Wemba” is a proper name in Old English and then “Lea” is the Old English name for a meadow or clearing. The combined name, Wembley, first appeared in an official charter issued in 825 by King Beornwulf in reference to the area where the London district is now located.
Location: Wembley Stadium is situated inside Wembley Park which is part of the London Borough of Brent in the northwest section of the city. The stadium is less than a half mile away from the small River Brent which runs into the River Thames. Wembley Stadium is located from about 140 to 190 feet above sea level.
Stadium Capacity/Size, Architect & Build Date: The new Wembley Stadium replaced the original stadium with its same name that stood in the same location from 1923 to 2003. New Wembley opened its doors on May 19, 2007 when it hosted the FA Cup Final match between Chelsea and Manchester United in a match as large as they get in English Premier League football. The 90,000 seat stadium was desgined by Foster and Partners and Populous, costing some 757 million Pounds (or about $1.2 billion!) to build.
Type of Field Surface: The pitch at Wembley Stadium was replaced 11 times in three years before it was replaced with a hybrid natural grass-artificial turf surface. Artificial fibers created by Desso Sports Systems were woven into the new playing field and irrigation system during June 2010.
Key Sports Teams: Without question, when the English national football plays its home games at Wembley Stadium, the entire eyes of the United Kingdom are on arena.
Most Popular Yearly Event: Besides hosting the widely popular English national games, Wembley Stadium hosts nearly every major playoff game for the various football leagues in the country. The stadium also hosts rugby playoffs, NFL (American) football games and even massive music concerts, for example Madonna in 2008 and U2 in 2009.
Fun Factoids: (1) Wembley Stadium is the second largest in Europe and the largest fully covered stadium in the world even though the 170-foot sliding roof does not cover completely leaving the pitch partially exposed to the elements. (2) The new stadium has a circumference of 1 kilometers and it encloses 4 million square meters inside its walls and under its roof, which is the equivalent to 7 billion pints of milk! (3) Desso Sports Systems wove some 30,000 miles of artificial fibers into the new pitch surface, and that is 5,000-miles more than the circumference of the Earth.
The Pléiades 1 High-Resolution Satellite Constellation
The Pléiades 1 constellation (or at least part of it!) has been in orbit since December 2011 and if you have not had a chance to check out any sample imagery, take a few moments and have a look at the gallery on our website. If you work with high resolution imagery, you should consider Pléiades 1 for your next geospatial project.
A variety of Pléiades 1 products are available from both a growing archive and as a new collection, including 50-centimeter (cm) pansharpened imagery and 50-cm panchromatic–2-meter (m) 4-band multispectral bundles. We are happy to discuss the technical specifications, pricing and tasking options available with this satellite constellation.
Working with Pléiades 1 since the launch of the first twin satellite, P1A, we have noticed that:
- Airbus Defense and Space is able to deliver on their tasking feasibilities.
The Apollo Mapping sales team can answer any questions you might have about the high resolution satellite constellation, Pléiades 1. We can be reached anytime at (303) 993-3863 or sales@apollomapping.com.
More sample images and technical information about Pléiades 1A and 1B can be found on our website here.
In this monthly article, we provide details on updates to Airbus Defense and Space GEO’s SPOTMaps product. SPOTMaps is an orthorectified 2.5-meter (m) and now 1.5-m natural color imagery layer with coverage over more than 110 countries–totaling an impressive 135 million plus square kilometers (sq km). For projects requiring a value-priced basemap better than what 15-m Landsat can offer, there is no other choice than SPOTMaps.

A 1.5-meter SPOT 7 natural color image collected over the city of London, England on July 3, 2015. If you would like to see this stadium in Pléiades 1 50-cm resolution (and even collected on the same day!) as a comparison, please click here. © CNES 2015, Distribution Airbus Defense and Space / Spot Image S.A., France, all rights reserved.

A 1.5-meter SPOT 7 natural color image collected over Wembley Stadium in the city of London, England on July 3, 2015. If you would like to see this stadium in Pléiades 1 50-cm resolution (and even collected on the same day!) as a comparison, please click here. © CNES 2015, Distribution Airbus Defense and Space / Spot Image S.A., France, all rights reserved
SPOTMaps Product Updates–August 2015
- To date, more than 26,882,000 sq km of SPOTMaps1.5 data have been released with some 2,102,000 sq km in the past month alone.
- These countries are currently in production and will be added to the SPOTMaps1.5 database soon or will be updated:
- Australia (part of the country)
- Central African Republic
- Oman
- Pakistan (part of the country)
- South Korea
- Sudan (part of the country)
- United Arab Emirates
- Production of SPOTMaps2.5 is complete now that SPOTMaps1.5 are being released.
For those who have never worked with SPOTMaps, below is a summary of key product specifications of the 1.5-m and 2.5-m versions as well as product differentiators.
Key Product Specifications

This map of SPOTMaps1.5 coverage shows the regions that have been released or updated recently as well as those currently in production. An Apollo Mapping representative can provide more details on the specific year ranges used in each mosaic.

This map of SPOTMaps2.5 coverage has been color coded to show the collection year which makes up the majority of each mosaic as well as those markets that were added in the final month of production (i.e. August 2013). An Apollo Mapping representative can provide more details on the specific year ranges used in each mosaic.
- SPOTMaps1.5
- Resolution:1.5-m
- Spectral Bands: true natural color (RGB)
- Horizontal Accuracy: 6 to 10-m CE90 (circular error 90%)
- Projection/Datum: UTM WGS84
- Source Data: SPOT6/7 satellite imagery
- File Format: GeoTIFF
- SPOTMaps2.5
- Resolution:2.5-m
- Spectral Bands: simulated natural color (RGB)
- Horizontal Accuracy: 10 to 15-m RMSE (root mean square error)
- Projection/Datum: UTM WGS84
- Source Data: SPOT5 satellite imagery
- File Format: GeoTIFF
Product Differentiators
- Recent and ready for immediate delivery and integration with your GIS
- Seamless, orthorectified coverage across countries and entire regions in 1.5-m and 2.5-m resolution
- Suitable for work up to 1:10,000 scale
- Custom product framing with minimum orders of ~100 sq km
- Product series is updated nearly every month
- Source data can be delivered with all SPOTMaps mosaics
- Volume and academic discounts are offered
- Multi-user licenses are available
If you would like pricing details and/or additional product details,such as date ranges and accuracy specifications, please let us know at sales@apollomapping.com or (303) 993-3863.

This month, we feature a handy tool that, well, might be handy for our non-GIS readers as well! This great freeware application built by Fookes Software, Easy Thumbnails, is the easiest application I have found to create low resolution (or down-sampled) versions of image files. With Easy Thumbnails, you can create thumbnails images for one image file or for a folder of image files. You have the ability to change the thumbnail size as well as adjust the contrast, brightness, etc. of the thumbnails as they are created. One item to keep in mind is that Easy Thumbnails does not create georeferenced previews, they are simply JPEG image files.
Until my next edition of the Free For All, happy hunting for free geospatial goodies!
Brock Adam McCarty
Map Wizard
(720) 470-7988
brock@apollomapping.com