
In this monthly feature, we span the globe to examine Our Changing Landscape with time series of medium resolution RapidEye satellite imagery. The RapidEye archive dates back to late 2008 and already contains more than 8 billion square kilometers of data. Last month we were in Florida with a look at the expansion of a naval air base, this month we go back to the other side of the world with a look at the recent construction of King Abdullah Port in Saudi Arabia.
The RapidEye Constellation
RapidEye is a constellation of five 5-meter medium resolution satellites each offering five spectral bands of information. The RapidEye constellation offers daily revisits to every location on the planet with a huge footprint that is 77-km wide. The data is priced competitively with a starting cost of $1.28 per square kilometer for all five spectral bands–academics do receive discounts. RapidEye adds a fifth band, the red edge, to the ‘traditional’ multispectral set of blue, green, red and near-infrared (NIR). The additional spectral data in the red edge band allows users to extract more useful land ‘information’ than can be from traditional 4-band imagery sources. When RapidEye imagery is ordered as a Level 3A Orthorectified product, images from multiple dates are extremely well registered, making it the ideal data source for Our Changing Landscape.
 Click on the image above to see an animation of 5-meter natural color RapidEye imagery collected over King Abdullah Port on November 29, 2009, January 21, 2011, November 21, 2012, December 23, 2013, December 3, 2014 and January 9, 2016. In this layer stack, you can see that in 2009 there was no evidence of the port; but by 2011, the port was already being dug into the landscape of Saudi Arabia. And then in the 2016 image, you can see an area of the port (on its south-east side) that looks ready to be dredged and expanded–that is one cool looking facility! (Images Courtesy: Planet)
The Construction of King Abdullah Port
King Abdullah Port (KAP) is Saudi Arabia’s first privately owned seaport and is part of the preplanned megacity, the King Abdullah Economic City. Located some 60 miles northwest of Jeddah on the shore of the busy Red Sea shipping lanes, KAP handled 1.3 million TEUs in 2015 which is about half of its current 2.7 million TEU annual capacity. To put that in perspective, the 50th busiest port in the world (i.e. Salalah, Oman) accepted 3.03 million TEUs in 2014. While it is unclear exactly when construction of KAP began, the port officially opened in September 2013.
Ye olde Internet is surprisingly lacking on interesting details about the construction of KAP, though it appears that the port was built extremely quickly by using huge concrete bricks for the deep water quay wall. In fact, they used a 1,200-ton floating crane to position the 720-ton concrete blocks on the surface of the ocean! In 2015, KAP received the two largest container ships in the world, the largest with a capacity of 19,224 TEUs. The current container terminal stretches over 36,000 feet or more than 6.8 miles. Okay well, without further ado, it is time to turn to the 5-meter RapidEye archive to see if we can get a better sense of the construction date as well as to check out how the build out progressed over the past years.
If you would like to find out more about using RapidEye for your academic studies, engineering projects or any landscape analysis, let us know at sales@apollomapping.com or (303) 993-3863.
Are you in need of imagery of a particular area as soon as possible?
Or do you need up-to-date imagery of an area that other satellites may have missed, even in historically competitive regions such as China, Nigeria and the Philippines?
If so, TripleSat is the satellite constellation for you!
TripleSat can be tasked to collect imagery of any location on Earth, every single day; and as the name suggests, TripleSat is a constellation of three satellites working in unison to collect high-resolution 1-meter panchromatic and 4-meter (m) multispectral imagery around the world. With the widest swath of any high-resolution system at 23.4 kilometers (km) and with daily revisits, TripleSat is an ideal choice when you need newly collected imagery of a given location.
 A preview of 1-m color TripleSat imagery collected over Dubai in the United Arab Emirates on October 31, 2015. (Image courtesy: 21AT)
A Focus on New Image Collection and Tasking
21AT, the owner of the TripleSat constellation, has placed all of their focus on new collections of imagery. This emphasis means that tasking the TripleSat constellation has the shortest timelines available. Traditionally, it may take many months to receive your requested imagery when tasking high-resolutions satellites, and this is especially the case in regions with higher demand and historic cloud cover. TripleSat is able to take daily collections of anywhere, making it the go-to option when seeking new imagery of a specific location. TripleSat imagery is also available to academics at a 20% discount.
The Widest Imagery Footprint Available
The TripleSat constellation features the widest imagery footprint of any high-resolution satellite with a width of at least 23.4-km. This larger width means that fewer scenes are needed for full coverage and thus tasking a large area can be accomplished more quickly. Not only does the TripleSat constellation collect imagery fast, it also looks great! Take a look at the imagery samples in this article taken over Alexandria, Egypt and Dubai, United Arab Emirates.
 This preview of color 1-m TripleSat imagery captures a neighborhood in the ancient city of Alexandria, Egypt and was taken on October 31, 2015. (Image courtesy: 21AT)
Key TripleSat Specifications
To familiarize yourself a bit more with TripleSat, here are a few of its key imaging specifications:
- Launch Date – July 10, 2015
- Spectral Bands – panchromatic, 4-band multispectral (blue, green, red, and near-infrared [NIR]
- Resolution
- 5° off-nadir–0.99-m panchromatic & 3.96-m multispectral
- 25° off-nadir–1.23-m panchromatic & 4.92-m multispectral
- 35° off-nadir–1.58-m panchromatic & 6.32-m multispectral
- Revisit Time
- 35° off-nadir or higher–daily
- 25° off-nadir–2 days, +/- 0 to 40° latitude; daily, greater +/- 50° latitude
- 15° off-nadir–3 days, +/- 0 to 30° latitude; 2 days, +/- 40 to 60° latitude; daily, greater +/- 70° latitude
- Swath Width – 23.4 km (varies with orbital height and off-nadir angle)
- Orbit Height – 651 km; three satellites in same orbital plane exactly 120° apart
When you want to task an area of the world lacking the current coverage you need, TripleSat is a fantastic solution. Fast, flexible and ready to task, this satellite constellation is definitely worth considering for your next project.
Please feel free to reach out to the Apollo Mapping sales team for further information or inquiries regarding the TripleSat constellation by phone at 303-993-3863 or by email at sales@apollomapping.com.
For those of you in need of ready-to-use, wide-area coverage mosaics, 5-meter natural color RapidEye Mosaics are a perfect fit. RapidEye Mosaics are virtually cloud-free and have been created with recent imagery collected during narrow time frames. With a 77-km wide footprint and five identical satellites in orbit, there is no better constellation to image huge areas in short times than RapidEye. These wide-area mosaics are competitively priced so ask your Apollo Mapping representative for a quote to support your next mapping project.
 A map of the off-the-shelf 5-meter RapidEye Mosaics (in green) that are available. Custom mosaics are available upon request.
September 2016 Coverage Update
- During September, Ethiopia was added to the RapidEye mosaics database.
- Also, as a note to our readers, the coverage for India is not complete but it does cover the northern half of the country.
Here is a summary of the key features and product specifications for RapidEye Mosaics:
RapidEye Mosaic Features
- Priced at less than $1.50 per square kilometer with a 500 sq km minimum order size
- Recent and virtually cloud free imagery (no more than 3%) collected in the most narrow time frame possible
- GIS-ready format
- Quick delivery as they are off-the-shelf mosaics
- Custom mosaics available if they are not offered now
RapidEye Mosaic Specifications
- Image Bands: True natural color mosaics created from raw red, green and blue spectral bands
- Resolution: 5-meters
- File Format: GeoTIFF with associated metadata files
- Bit Depth: 8-bit color balanced
- Projection/Datum: UTM WGS84
For more information about RapidEye Mosaics, you can reach an Apollo Mapping representative at (303) 993-3863 or at sales@apollomappping.com.

Map Mavin is our GIS cloud, have you checked it out yet? If not, you can find out more information about it here.
If Map Mavin looks like a service you could use to create the web maps required for your next project, then you need to check out this monthly article where we give away five (5) free subscriptions!
So here is how this will work. Each month, we will give away five free one-month subscriptions to Map Mavin–that is a $20 value per subscription! Included in this free one-month subscription will be 5 gigabytes (GB) of cloud-based storage and download bandwidth. Once you exceed this 5 GB limit, you would be charged $0.75 per GB for the storage and/or bandwidth you use in the rest of the month. Then you would pay a base rate of $20 per month for Map Mavin from there if you decide to keep the service active. And if you are already a Map Mavin client, we will credit your account $20 if you win the contest.
To win, you will need to submit the correct answer to the trivia question below. You have 24 hours from the time our newsletter sends to submit your answer. We will randomly draw the five winners from the group of readers who answered correctly; and then announce these winners in the next edition of The Geospatial Times.

Okay, ready, set, here we go:
This American college campus has a building named the same as a neighboring state’s large river city on the eastern side of its main Quadrangle. What is the name of this college and what city and state is it located in?
You have 24 hours to get us the correct answer to this question by email. Please submit your answers to sales@apollomapping.com.
September 2016 Free For All Answer & Winners!
Last month’s answer was Del Mar, California, USA. We had just one winner in September, Kevin Grootendorst, nice work on getting it correct!
Good luck and let us know if you have any questions about Map Mavin!
Humans have a love/hate relationship with asteroids. They can spell out our untimely demise or unlock the mysteries of the Universe. Since our Sun hypothetically has many, many more years’ worth of fuel left the most imminent risk, outside of our own self-destructive behavior, is an asteroid strike. The Kepler and K-2 missions focus on finding asteroids that could be potentially hazardous to life on Earth, i.e. those objects that could be on a direct path to the planet. Getting funding for this kind of work is relatively easy as Congress has seen Armageddon enough to consider this a real possibility and they can’t be sure they are on the list for the underground bunker.
Outside of our awesome fear of going the way of the dinosaur, asteroids contain material that many consider to be the building blocks of our Universe. There are three general categories of asteroids, of these C-type or carbon-rich asteroids are believed to be the most primitive, flying through space relatively unscathed for 4 billion years. Many scientist hypothesize that carbon-rich asteroids brought the building blocks of life to Earth, from amino acids to other organic molecules. Getting a sample from one of these asteroids is an astronomers dream, borne from this dream is the OSIRIS-REx mission.
The Rosetta mission was the last time a probe visited an asteroid and touched down, but it didn’t bring back any samples. Prior to that, Japan’s Hayabusa 1 attempted to land on an asteroid, Itokawa, to collect samples and return to Earth. However it lost communication and crashed into the asteroid, the sampling mechanism didn’t operate and the only particles that made it back to Earth were mostly contaminated. OSIRIS-REx launched on September 8, 2016 with the illustrious goal of bringing a sample back for in-depth analysis into the composition of asteroids and their origins.
Picking the best candidate for another asteroid mission is a process of elimination. First, the asteroid needs to be orbiting close to Earth but also not too close, and also easily accessible for a spacecraft. The asteroid also can’t be too small due to rapid rotation when the asteroid is less than 200 meters in diameter. Last on the list is composition, some were removed since their composition was unknown or they weren’t carbon-rich asteroids. In the end, an asteroid called Bennu was selected for the OSIRIS-REx mission.
After 2 years of travel, OSIRIS-REx will rendezvous with the Bennu asteroid. For the next year the satellite will orbit and map the surface of the asteroid. The OLA instrument onboard will use scanning LiDAR (these are lasers that measure distances) to create a 3-D model of the asteroid’s surface. These measurements will help select the best sampling site for the instrument. OSIRIS-REx also includes a number of cameras for imaging the asteroid and the surrounding area, as well as an infrared spectrometer and an X-ray imaging spectrometer. Once a suitable site is chosen, the satellite will approach the area and collect a sample with its Touch-And-Go Sample Acquisition Mechanism (TAGSAM). The spacecraft will then return to Earth with its sample in tow for eager astronomers to inspect. The successful completion of the missions on September 24th 2023 will leave researchers with a plethora of data to analyze with the hope that some of the mysteries of our Universe will be unraveled.
For the past month, we have been busy fixing up Map Mavin for its commercial launch; and we are happy to report that we are within weeks and perhaps days of launch! In fact, we fully expect to open up access to Map Mavin for a group of about 100 users in October. Would you like to be part of this initial group of users? If so, let us know by email at sales@apollomapping.com.
In the meantime, check out this short video put together by Fletcher for our Map Mavin Methods series, whereby he shows users how to change the symbology of web map layers as well as how to work with redlining tools.
While we are busy readying Map Mavin for launch, now is a great time to tell you a bit more about our soon-to-launch web mapping service.
Some of you may have used other GIS cloud services in the past, and in many ways the Map Mavin will be similar to these. But the Map Mavin will distinguish itself in a variety of important manners. Here are the key features that will make unique Map Mavin unique.

Access
We’re here to help give meaning to your data. With Map Mavin, you can share your data with whomever you’d like, whenever you’d like, from whatever device you’d like. Backed up by redundant and distributed Amazon S3 servers, you can rest assured you’ll never lose your hard work. Plus, we’re versatile: Map Mavin accepts a wide variety of data formats, including shapefiles, KMLs and KMZs, GeoTIFFs and geodatabases. You can easily download your data anytime with our handy, high–speed export features. Share it or protect it — you have complete access and control with Map Mavin.
Create
After you upload your data to Map Mavin, the real fun begins. Our easy–to–navigate web interface allows you unlimited power to give your data impact and meaning. Using our secure, robust GIS cloud, you can even use the same data to create unique maps shared with different users or teams — just like creating different playlists sourced from the same music library. Keep it private or public, it’s your choice–the possibilities are infinite.
Collaborate
Creating and sharing a map is one thing, but with Map Mavin, your whole team can collaborate and connect in real time. Once you invite users to a map, you can start making informed decisions together based on your data and needs. Within this new geographical context, you can reach important decisions easily — such as where to put a road, where to send doctors or even as simple as where to go for a hike. And with our real-time collaboration mode, you can chat with your peers or lead an all–user meeting from anywhere in the world. Included at no extra cost, you can have all hands on deck to make your web maps the best they can be.
Get Started
We like to think of ourselves as the Robin Hoods of GIS — and we believe that quality map–making software should be accessible to everyone! After all, faint-worthy contracts never won fair lady. We’re not fans of contracts that force you to pay for a product you don’t use, so we made our service month–to–month and contract free. With affordable pricing and flexibility unheard of in the GIS industry, we want to help you create meaningful, impactful maps that give you the power to make informed decisions — whether it’s for a critical medical project in another country, or a new neighborhood to raise your kids.
Do you have any specific questions you would like answered about the Map Mavin? If so, let us know by email at sales@apollomapping.com.
Every time we look at WorldView-3 (WV3) imagery, we are blown away. And we hope you are equally impressed with the data! Last month, we featured some colorful images of Rome, Italy, and in October we head over to Asia with a look at an idyllic nature image over Detian Falls on the China and Vietnam border for this WV3 Image of the Month.
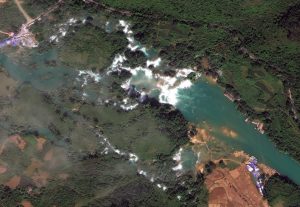 The series of falls known as Detian Falls on the Guichun River straddles the Vietnam and Chinese border. Detian Falls it is about 200-meters across at maximum and drops some 70-meters. This 30-cm WorldView-3 image was collected on October 15, 2015. (Image Courtesy: DigitalGlobe, © 2016)
PLEASE NOTE: Effective May 2016, WorldView-3 prices dropped again! Are you interested in finding out more about these price drops? If so, send us an email at sales@apollomapping.com.
WorldView-3 launched in late 2014 and it is the most advanced satellite the commercial marketplace has ever had access to. Here are a few of the features that really set it apart from the competition:
- Improved Resolution
- Higher resolution means you can see more detail in WV3 imagery.
- Data collected at nadir will have 31-centimeter (cm) panchromatic, 1.24-meter (m) visible and near infrared, 3.7-m SWIR and 30-m CAVIS bands.
- At 20 degrees off-nadir, the resolution is 34-cm panchromatic, 1.38-m visible and near infrared and 4.1-m shortwave infrared.
- Per US government regulation, all SWIR orders are produced at a maximum resolution of 7.5-m. CAVIS bands are not available for purchase at this time.
- Additional Spectral Bands
- If spectral analysis is part of your project, then no other satellite can match WV3 with its: 8 bands of visible and near-infrared data; and 8 shortwave infrared bands which are crucial for geological studies.
- Better Positional Accuracy
- With accuracies of 3.5-m CE90% or better (without ground control even!), WV3 has no rivals for its enhanced positional accuracy.
- Daily Revisits
- At 40 degrees latitude, WV3 will be able to image each location daily with 1-meter or better resolution and then every 4.5 days at 34-cm resolution or better.
- Increased Collection Capacity
- WV3 features a 13.1-km swath width (at nadir) with the ability to collect up to 680,000 square kilometer (sq km) of high-resolution data per day.
- Improved control movement gyros translate into larger maximum contiguous collection areas per pass, with up to ~7,500 sq km of mono imagery and ~3,000 sq km of stereo possible.
If you are interested in WorldView-3 imagery for your next project, please let us know by phone, 303-993-3863, or by email, sales@apollomapping.com.
You can also find more samples and technical information on our website here.
Since 2000, the International Space Station (ISS) has been continuously occupied and visited by 224 people from 18 different countries. A mechanical behemoth in space, it is physically cut off from the rest of the world. When a person leaves the station you might imagine they take with them whatever personal affects they brought on board, to the naked eye this is a true statement. However, visitors all leave a part of themselves and the planet behind. Unseen microbes cling to our bodies and clothes from the inside and out, we need them to survive so there is no getting rid of them. After 16 years, in orbit the ISS is far from a sterile environment and now has its own microbial ecosystem, this phenomenon is called the Microbiome of Built Environments (MoBE).
To further the understanding of the ISS’s unique environment and space environments in general NASA has partnered with the Alfred P. Sloan Foundation. The Sloan Foundation is accepting proposals for promising postdoctoral projects relating to microbiological research of MoBE. Grant winners will be selected and supplied funding for their projects. As humans travel further into space for longer periods of time, this research will become more important for the health and safety of the astronauts on board. The results from this research will be added to the GeneLab site to be reviewed and accessed by the greater scientific community. GeneLab is an open access database of spaceflight data intended to expand access to molecular and biological research and data collected aboard the ISS.
In related but separate news, researchers on the ISS have successfully sequenced DNA in microgravity for the first time. Using a commercially available device called the MinION, astronaut Kate Rubins tested samples of DNA from bacteria, mouse and viruses sent to the ISS from Earth. The same samples were tested on the ground as a control for the experiment in microgravity. The MinION applies a positive current to a porous membrane in the device, and as the DNA molecules pass through the membrane, the pores are partially blocked and the current changes based on the type of DNA. These changes are unique to each DNA sequence allowing researchers to identify the specific DNA sequence being tested.
Why is this so awesome you ask? Well molecules aboard the ISS or future spacecraft could be properly identified with this technique, from harmless microbes to illness, disease and bacteria. In the distant future it could be used to discover DNA-based life outside of Earth. This gets us one step closer to having full lab capabilities in space, making spaceflight safer and more autonomous. Long distance space travel will only be possible when crew members have all the resources and tools necessary to operate for long time periods away from the resources found on Earth. All of these seemingly small steps get is closer and closer to long term spaceflight, USS Enterprise here we come!