
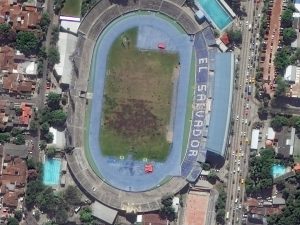


 San Salvador is the capital and largest city in El Salvador. With a history pre-dating the European colonization of the Americas, San Salvador is a mix of traditional local architecture with styles you might see in Europe. In the four images here, you see the mix of architecture as well as the colorful rooves and buildings that characterize the Central American capital. These 30-cm WorldView-3 images were collected on November 27, 2017 and have been processed by Apollo Mapping for improved clarity and colors. (Images Courtesy: DigitalGlobe)
Every time we look at WorldView-3 and WorldView-4 (WV3/4) imagery, we are blown away. And we hope you are equally impressed with the data! Last month, we found ourselves in a historic city in central Europe-Asia, and for October we travel to the opposite hemisphere with a look at one of Central America’s largest cities, San Salvador, El Salvador.
PLEASE NOTE: Effective May 2016, WorldView-3/4 prices dropped again! Are you interested in finding out more about these price drops? If so, send us an email at sales@apollomapping.com.
WorldView-3 launched in late 2014 and WorldView-4 launched in late 2016; taken together they are the most advanced satellite constellation the commercial marketplace has ever had access to. Here are a few of the features that really set these satellites apart from the competition:
- Improved Resolution
- Higher resolution means you can see more detail in WV3/4 imagery.
- Data collected at nadir will have 31-centimeter (cm) panchromatic, 1.24-meter (m) visible and near infrared, 3.7-m SWIR (WV3 only) and 30-m CAVIS (WV3 only) bands.
- At 20 degrees off-nadir, the resolution is 34-cm panchromatic, 1.38-m visible and near infrared and 4.1-m shortwave infrared.
- Per US government regulation, all WV3 SWIR orders are produced at a maximum resolution of 7.5-m. CAVIS bands are not available for purchase at this time.
- Additional Spectral Bands
- If spectral analysis is part of your project, then no other satellite can match WV3 with its: 8 bands of visible and near-infrared data; and 8 shortwave infrared bands which are crucial for geological studies.
- Better Positional Accuracy
- With accuracies of 3.5-m CE90% or better (without ground control even!), WV3/4 has no rivals for its enhanced positional accuracy.
- Daily Revisits
- At 40 degrees latitude, WV3/4 will each be able to image every location daily with 1-meter or better resolution and then every 4.5 days at 34-cm resolution or better.
- Increased Collection Capacity
- WV3/4 feature 13.1-km swath widths (at nadir) with the ability to collect up to 680,000 square kilometer (sq km) of high-resolution data per day per satellite.
- Improved control movement gyros translate into larger maximum contiguous collection areas per pass, with up to ~7,500 sq km of mono imagery and ~3,000 sq km of stereo possible.
If you are interested in WorldView-3 and/or WorldView-4 imagery for your next project, please let us know by phone, 303-993-3863, or by email, sales@apollomapping.com.
You can also find more WV3 samples and technical information on our website here and then WV4 samples and information can be found here
The Apollo Mapping sales team is always looking out for new and useful geospatial datasets to add to our already massive list of available digital elevation models (DEMs) and satellite images. And this month we are happy to introduce a 5-meter (m) DEM with near global coverage! In conjunction with our new partner, NTT DATA, we are now able to offer 5-m AW3D Standard DEM products from an archive covering more than 80% of the world. As an added bonus, you are able to search for AW3D in Image Hunter, making this DEM our fastest to query, order and deliver.
 A Level 2 Standard 5-m AW3D DSM sample from Chiba, Japan. (Data Courtesy: NTT DATA)
Produced from an archive of more than 3 million ALOS stereo images, AW3D Standard can be delivered as both a 5-m digital surface model (DSM) or a 5-m digital terrain model (DTM). With delivery times of 3 weeks or less (even for a DSM), there is no elevation model on the market with a quicker delivery time.
Here are a few of the crucial product specifications of AW3D Standard:
Resolution: 5-m
Date of Images Used: 2006 to 2011
Horizontal and Vertical Accuracy: 5-m LC90 and LE90
Product Levels: level 1 DSM (raw data); level 2 DSM (voids infilled); level 2 DSM (standard); level 3 DTM
Average Delivery Time: 1 to 3 weeks
Pricing: email us for your price list!
To find out how AW3D can help with your next project or to get a new DEM price list, email us anytime at sales@apollomapping.com.
Here in our monthly Map Mavin Methods column we try to showcase a particular feature, ability or “hack” of our system that can help you make better maps. This month, however, I thought it would be best to bring together the facts and tips of several of our published articles and videos, and consolidate them to give you a clearer picture of the particular topic.
When it comes to making maps, the real key to creating something of value (both informationally and aesthetically) is to obtain good, high-quality data. Yes, you can absolutely create your own data and with Map Mavin doing so is a breeze. Yet whether with Map Mavin or other software options, a threshold of human ability will inevitably be reached as one approaches larger scale problems. Sure, I can map out every building’s footprint on my block or maybe in my neighborhood, but in the City of New York…no way! To do so requires the collaborative efforts of many people across multiple agencies and teams. If it sounds daunting, that’s because it would be for one person! Fortunately, the “open data movement” has encouraged large institutions to release some of their data for free to the public. Everything from the species of trees in a city to 311 noise complaints can now be found online and downloaded onto your device. How, then, do we go about finding these sources?
There are two main sources of open data in the context of Map Mavin. First, we can seek out data by using an Internet search engine and mentioning the given area or type of data we’d like to find. As a general guiding principal (this is subjective but very often the case), large cities are a fantastic place to start. American cities such as Chicago and New York, counties such as Boulder, CO and Los Angeles County and many others have particularly robust open data portals (this is due in part to some of these being early adopters of the idea). This extends to states, the US Federal government, and other nations as well so be sure to dig around and see what you can find! In searching for files, you’ll simply want to keep an eye out for the formats that Map Mavin accepts (.shp, .tif, .kml, .kmz, .json and .geojson) and you’ll be good to go!
Now if this sounds like a hassle or beyond your skill level (or desire), do not panic! After considering it in internal discussions for some time we’re proud to announce the release of our own internal data portal! With constant updates and already over 11,000 spatial files inside, chances are it contains data that would prove valuable to your next project. To access it, you’ll want to go to the Layers tab and then click Open Data Library. Alternatively you can visit the portal directly by visiting the following URL: client.mapmavin.com/library
Please note that you can import files directly into your Map Mavin account and also download them as GeoJSONs.
As always, Happy Mapping!
Fletcher Berryman
Cloud Tamer
(970) 710-0909
fletcher@apollomapping.com
In this monthly feature, we span the globe to examine Our Changing Landscape with a time series of medium resolution RapidEye satellite imagery. The RapidEye archive dates back to late 2008 and already contains more than 14 billion square kilometers of data. In September we found ourselves in Japan looking at a series of recent eruptions on Mount Ontake, and for this Our Changing Landscape we stick with the volcano theme, focusing this time on Mount Yasur, Vanuatu.
 Click on the image above to see an animation of 5-meter natural color RapidEye imagery collected over Mount Yasur on March 21, 2011, January 21, 2013, February 18, 2015 and June 22, 2016. As has been the trend with these volcano articles, the four images here have smoke rising out of the calderas which makes color balancing the images properly nearly impossible. But regardless, if you check out the internal caldera, you can certainly see changes in its shape and dimensions from 2011 to 2016. All things said, some pretty neat images here! (Images Courtesy: © Planet 2018)
The RapidEye Constellation
RapidEye is a constellation of five 5-meter medium resolution satellites each offering five spectral bands of information. The RapidEye constellation offers daily revisits to every location on the planet with a huge footprint that is 77-km wide. The data is priced competitively with a starting cost of $1.28 per square kilometer for all five spectral bands–academics do receive discounts. RapidEye adds a fifth band, the red edge, to the ‘traditional’ multispectral set of blue, green, red and near-infrared (NIR). The additional spectral data in the red edge band allows users to extract more useful land ‘information’ than can be from traditional 4-band imagery sources. When RapidEye imagery is ordered as a Level 3A Orthorectified product, images from multiple dates are extremely well registered, making it the ideal data source for Our Changing Landscape.
The Many Eruptions of Mount Yasur
Mount Yasur is a 1,184 foot (361 meters) tall volcano located on Tanna Island which is a part of the island nation of Vanuatu. A part of the Ring of Fire, Mount Yasur is a constantly active stratovolcano with an iconic steep mountain profile and a circular caldera centered on top. In 1774, Captain James Cook spotted the islands of Vanuatu largely due to the volcano’s glow from its nearly hourly eruptions. Mount Yasur is one of Vanuatu’s biggest tourist attractions and with its non-stop eruptions for hundreds (possible thousands?) of years, it is ringed by a buffer of forests and grasslands from the inhabitants of Tanna Island. As this is a wrist-injury shortened article, it is time to turn to the 5-meter RapidEye archive to see if we can capture some of these hourly eruptions in the imagery record!
If you would like to find out more about using RapidEye for your academic studies, engineering projects or any landscape analysis, let us know at sales@apollomapping.com or (303) 993-3863.
Welcome back to Map Mavin Methods, where we walk you through the endless list of things you can do with our web-based mapping platform! While we always have more to share with our readers than we cover at any given time, this past month has been quite possibly our busiest ever. So many features and tools have been added that I honestly was unsure where to begin for this month’s article! And since we try to highlight one particular function here, I highly, HIGHLY encourage you to head over to www.mapmavin.com to sign up for our free 31 day trial. I know what you’re thinking, “great, one more thing to sign up for”… I often feel the same way. We’ve gone ahead and done away with any need for a credit card number to get started on your trial to make this process as simple as possible. Why? Because we’re confident that once you see Map Mavin you’ll understand why we’re all so excited to share it with the world!
Now with my shameless plug out of the way, let’s jump right into this month’s Map Mavin Methods. For September, we’re highlighting one of the biggest additions to the system to date: the integration of DigitalGlobe’s global imagery basemap. As longtime partners with DigitalGlobe (DG) on the imagery side of our business, we’ve always championed their data as the best out there. Now you can go to your web maps and toggle several DG basemap options with the click of a button. So how do you do it? Here’s how!
Adding DigitalGlobe basemaps to your web maps is no different than toggling on any of the other basemaps available in Map Mavin. To do so, go to a map you’ve made by clicking on the “Eye” icon on the bottom-right corner of a project under the Maps tab in the Admin Panel. Once inside your map, click the basemap button in the bottom-left of the screen (the icon looks like a series of three stacked layers).
From here you’ll notice a wide range of options to choose from. The options Satellite, Satellite with Labels, Recent Satellite and Recent Satellite with Labels are all DigitalGlobe options. You might be wondering, “what’s the difference here?” Satellite and Satellite with Labels will generally be less cloudy or cloud-free but possibly older imagery, whereas Recent Satellite and Recent Satellite with Labels are more recent but may be cloudier. Try out both to see what’s best for your project!
For any other questions or comments regarding Map Mavin, don’t hesitate to reach out to me (Fletcher) directly!
Fletcher Berryman
Cloud Tamer
(970) 710-0909
fletcher@apollomapping.com
In this monthly piece, we give our readers a sense of the high-resolution imagery coverage collected over a geography during a specified window. To do this, we pick a high-resolution satellite constellation, a defined time period and area of interest, then report key statistics on the total amount of imagery collected in square kilometers (sq km). Without further delay, let’s jump into our analysis.
 This map shows the areas imaged by the WorldView-2/3/4 constellation from January 1 to March 31, 2018 over Indonesia and the Philippines. Please note that in many instances, multiple images were collected over the same area which is difficult to portray on this static map.
Graphic Region of Interest: Indonesia and Philippines plus off-shore islands
Land Mass Covered: 2,180,911.0 sq km
Time Period: January 1 to March 31, 2018
High-Resolution Satellite Constellation: WorldView-2/3/4
WorldView-2/3/4 Constellation Imaging Statistics–Indonesia and Philippines
Total Area Collected: 2,704,295.6 sq km; 10,015.9 sq km per satellite/per day
Area Collected @ 20% or Less Clouds & 30 Degrees or Less Off-Nadir: 403,399.4 sq km; 1,494.1 sq km per satellite/per day; 14.9% of total
- It’s tech time again so let’s get going now!
Gold coated nanoparticles can efficiently convert water to Hydrogen gas.
This algae eats plants and produces biofuel from it.
3D printed electronics are around the corner.
Food nanoparticles can make cement stronger and greener.
 The July 2018 NOAA temperature percentile departure map shows large pockets of record warmth over northern Europe, the Middle East and western Africa. There were large pockets of cool weather off Greenland and over north-central Asia.
- The July NOAA global climate report is out and well our planet continues to heat up! July 2018 was the fourth warmest July on record and it was the fifth hottest month on record over the land masses of Earth since 1880. We are betting next month will continue to set heat records, stay tuned but it’s a safe bet we are right!
-
- In honor of National Native American Indian day on September 28th, my Google search of the month was, “GIS and Native American.” If you go through the copious amount of results, you might find this article by Leanne Knott of the University of Minnesota about using GIS to predict locations of Indian archeological sites. The approach brings together a variety of spatial layer, which is very cool, but it does not show if the predicted sites lined up with what they found in reality.
- Last month we reviewed Lewiston, Maine’s online GIS resources and this month we move further down the East Coast with a review of Maryland’s second largest city’s GIS, Frederick. The GIS homepage is little more than a page of a few relevant links: one to access printable PDF maps, and the other is a link to a collection of limited web maps. Unfortunately we see no way to download the actual GIS files the city maintains.
Brock Adam McCarty
Map Wizard
(720) 470-7988
brock@apollomapping.com

 (Images Courtesy: DigitalGlobe. Processed by Apollo Mapping for improved color accuracy and clarity.)
We love maps.
We love imagery.
We love work breaks.
We hope you like them as well!
September is here, wow does time fly (especially when you have a broken wrist like the author of this piece)! Have you taken a work break recently? If not, it’s time to get up from your desk and go outside for some fresh air. But before you head outside, check out this 30-centimeter WorldView-4 image collected over Burning Man on September 1, 2017 (please note that these images files are huge!). As an interesting comparison of 50-cm Pléiades 1 versus 30-cm WorldView-4, check out our regular piece on stadiums which features the 2016 edition of Burning Man as well as provides a bit of context on the annual party. Can you find your 2017 basecamp in this 30-cm image?!
Have a great rest of your workday!